Hello, Excellers. Welcome back to one of the last #FormulaFriday Excel blog posts of 2020. Often you will need to display a value as well as percent in the same report. So, more formula (or no formula in this blog post) fun. Today I will show you how to avoid using formulas to do this! Yes, that is right it’s not formula Friday really. We go back to one of the best tools in our Excel took kit, the Pivot Table.
So, let’s quickly build a Pivot Table using a sample data set. A partial view of the total set is seen below.
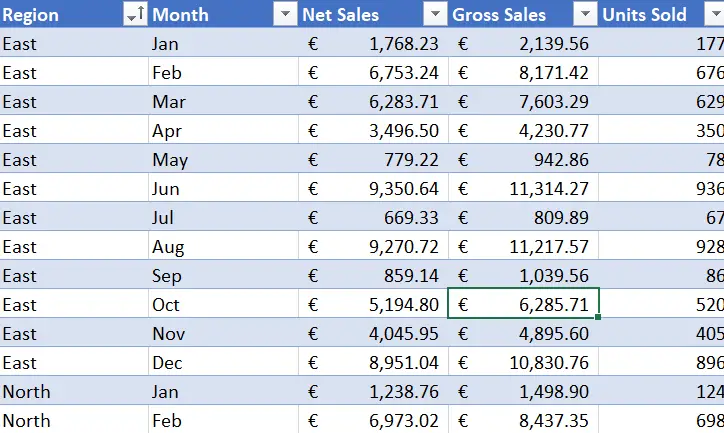
It is a simple data set that shows Regional and Monthly Sales of units of a product.
Build The Pivot Table.
So, the first step is to build the Table. I have chosen to display the SUM of Gross Sales per Month.
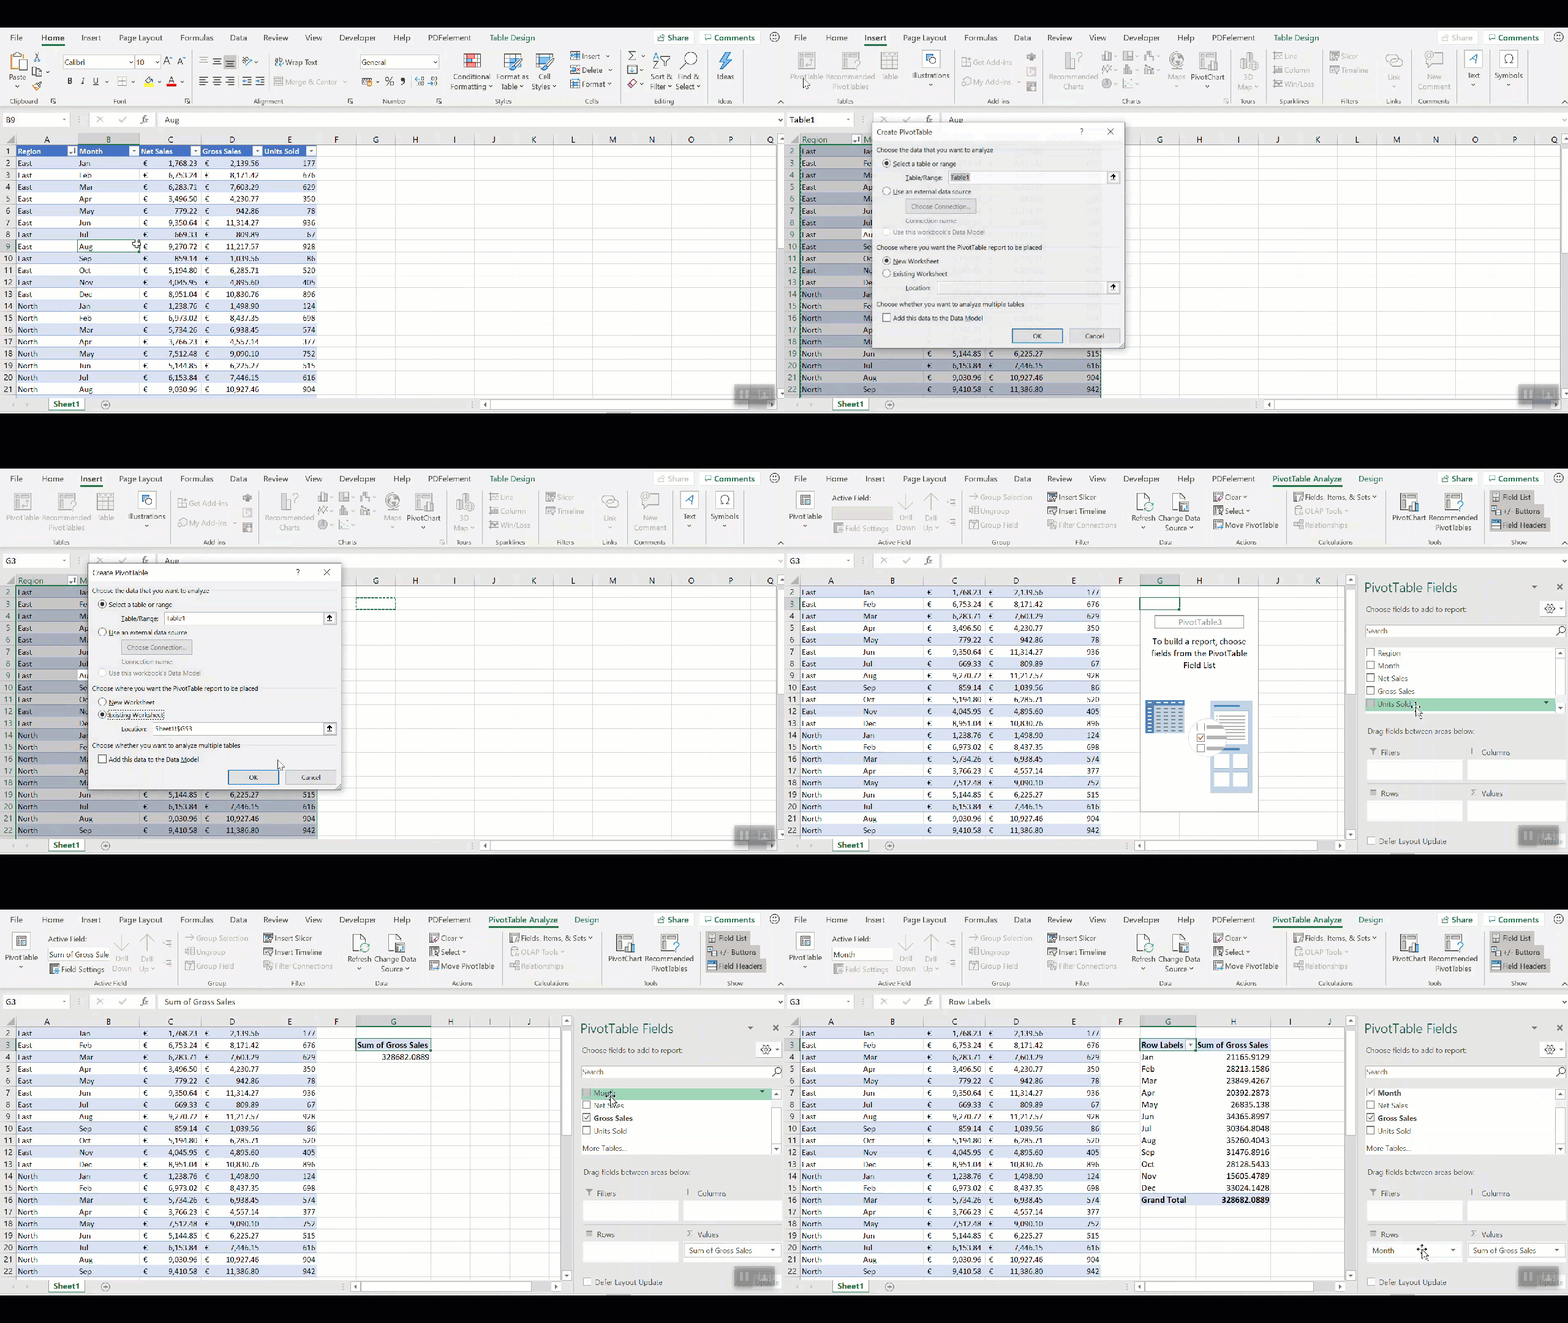
Add Gross Sales Field To The Pivot Table.
Next, drag the GROSS Sales field to the Values area of the Pivot Table which does the hard work for us. Then add the Month field to the Rows area to easily calculate the Gross Sales per month.
The requests for this data or report is to show not only the ACTUAL GROSS sales per month but the % SPLIT PER MONTH of TOTAL GROSS SALES. This is really easy with ouR Pivot Table solution.
So, my total gross sales for the full year is 328682.09. There are TWO ways to show the monthly percentage split.
METHOD 1.
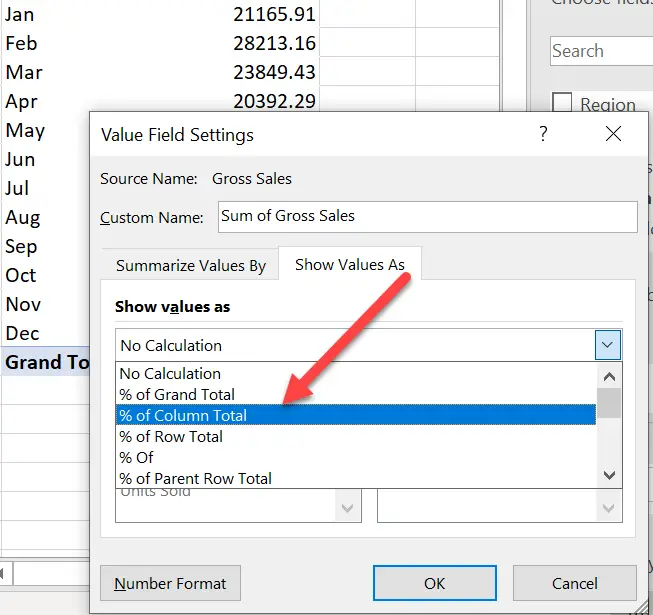
- Right Click on the data area where your gross sales is shown.
- Select Value Field Settings.
- Click the Show Value As Tab.
- Select % of Column Total.
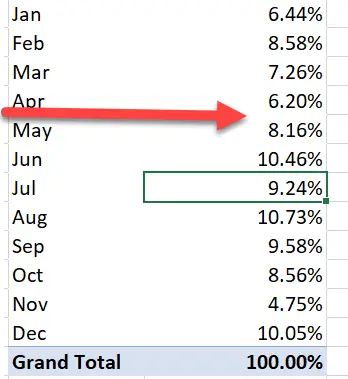
This will change the monthly gross values to a percentage of the full years of gross sales. Showing just these sales as a percentage split. This is great information. We easily can identify that most sales occurred in June, August and December.
METHOD 2. Adding Value And Percent.
If you want to display the ACTUAL GROSS sales AND the % split, then this second method is the one to use.
- Drag the GROSS Sales field to the value are of the Pivot Table (AGAIN).
- You now have both the % split and the actual sales value.
- YES! Easy as that!.
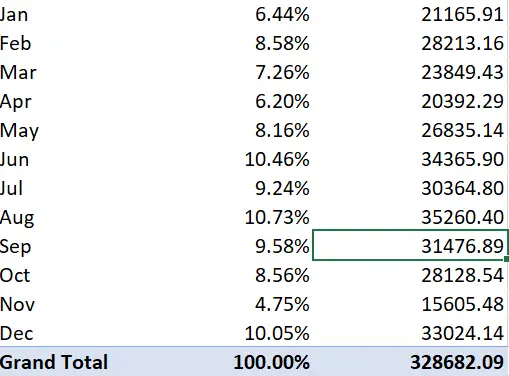
Did you know you can add the same field to the Pivot Table data area over and over again? You can. Very useful it is too!. An easy way to show value and percent on the same Excel report.
