In Excel, unless you have a dynamic data set, or your data is an Excel table, then you may need to manually add data to your existing Excel chart if you want to display more data than your original chart displays.
Here are four great and easy ways to get more data into your exiting Excel chart.
Firstly we can create a default chart really quickly by selecting your data and hitting ATL+F1.. Excel will put a chart on your existing worksheet you are on. Handy….so we have our basic chart.

So- onto getting some new data into our brand new Excel chart. I said 4 ways so let’s start with the first.
1. Copy Your Data & Click On Your Chart
So, let’s add in some more data- another line in Row 10.
- Just copy the row data

- Click on the outside of your chart
- Hit Paste

Your chart will update. Easy as that.
2. Using Copy and Paste Special
This second method gives you even more control as you can hit Copy and then again click on the edge of chart but then just select Paste Special and there you complete control of what is pasted.

Excel will display multiple options for you for full control of what is pasted

3. Drag The Data Finder Edges
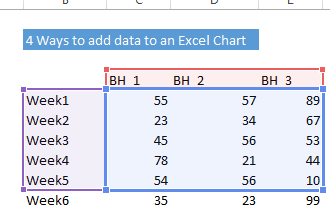
Ok, third method. When you click on your chart, you will see the data in your chart highlighted in your data source usually the edges will be coloured as below.

All you need to do then is drag the edge of the range finder to include your new data. Easy. Your Chart will update
4. Using The Fill Series
I never use this method very much as it is a bit long winded, but you can use it as a method to add data to your chart.
- Right click on the chart
- Select the Select Data option, or go to the Design tab and on the Data group click on the Select Data button.
- A Select Data Source dialog box opens and the chart source range get’s highlighted with the ‘marching ants’ as we like to call them.

- Click the Chart data range field and select the new data range.
- Click the OK button and your chart will be updated with the new data. I this case it is B4 To E10
There you are 4 ways to add new data to an existing Excel Chart.
If you want more Excel solutions to formulas and charting then I recommend
A structured and comprehensive online training program for learning Microsoft Excel. It is full of real world examples to work through.