Excel is a powerful tool for data analysis and presentation. With its built-in formulas and functions, you can create complex reports and graphs with just a few clicks. However, even the most experienced Excel users can find themselves overwhelmed by all the options available to them. In this blog post, we’ll show you how to use the Quick Analysis Tool to make data analysis easier than ever. So, from Excel 2013 onwards, the Quick Analysis Tool makes it really easy to analyse your data quickly and easily. It contains a variety of Excel tools. The tool can be used with data from a range of cells or an Excel data table.
How To Access The Quick Analysis Tool.
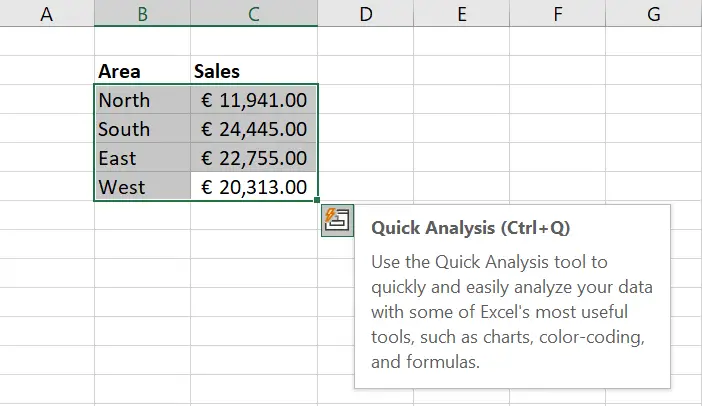
So, it is really easy to get started with the Quick Analysis tool. Once you select a range of cells or an Excel data table, the tool appears at the bottom right of your data set. A range of analysis tools is now available to choose from.
Use The Quick Analysis Shortcut.
If you are an Excel shorty or shortcut person then of course there is a shortcut for the Quick Analysis tool. Simply hit Ctrl+Q. The result is the same. All your analysis options.
What Does The Quick Analysis Feature Do?.
If you want to do some really quick analysis of your data set then this feature this a great place to start. Just select the data range and the Quick Analysis feature will appear.
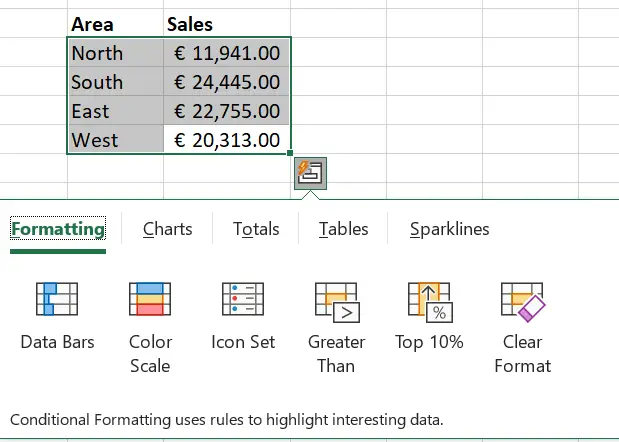
The options that are available will appear. These include
- Conditional Formatting
- Charts
- Totals
- Tables
- Spark Lines
So, these are some very handy quick tools at your fingertips. The options menu can be seen in the screen grab below.
So, using my sample data set let’s run through some zippy quick analysis.
Conditional Formatting.
First of all, let’s run through some Conditional Formatting that is available. Conditional formatting will allow you to highlight your data by adding in Data Bars, Colours and Icons. A great tool for quick visualisation.
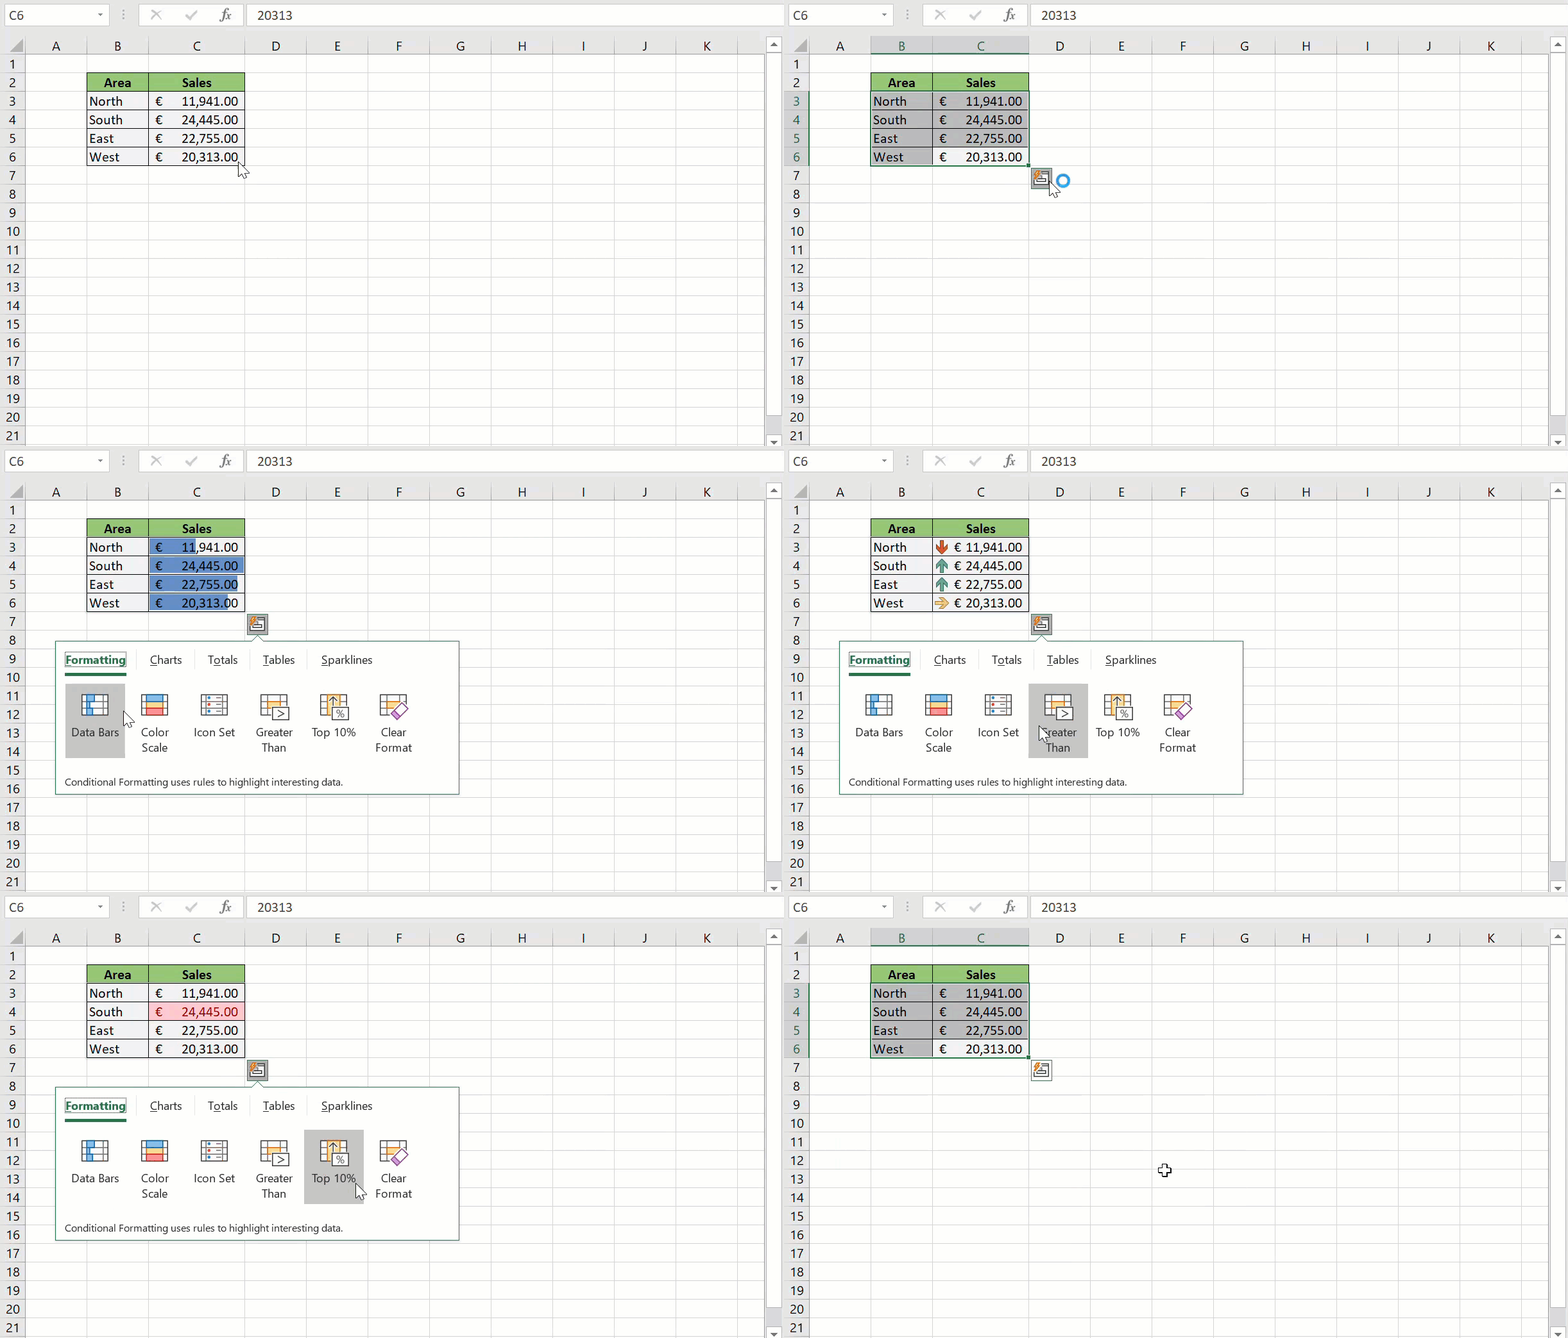
Of course, if you want to use the full Conditional Formatting set of tools in Excel then just navigate to Home Tab | Style Group | Conditional Formatting.
Charts.
Next, there are a number of charts that can be created with a click or two. If you select Chart in the Quick Analysis Tool then the recommended charts for the data will be displayed. Simply place the mouse the options. You will see the previews. You can then select the option you want by clicking it.
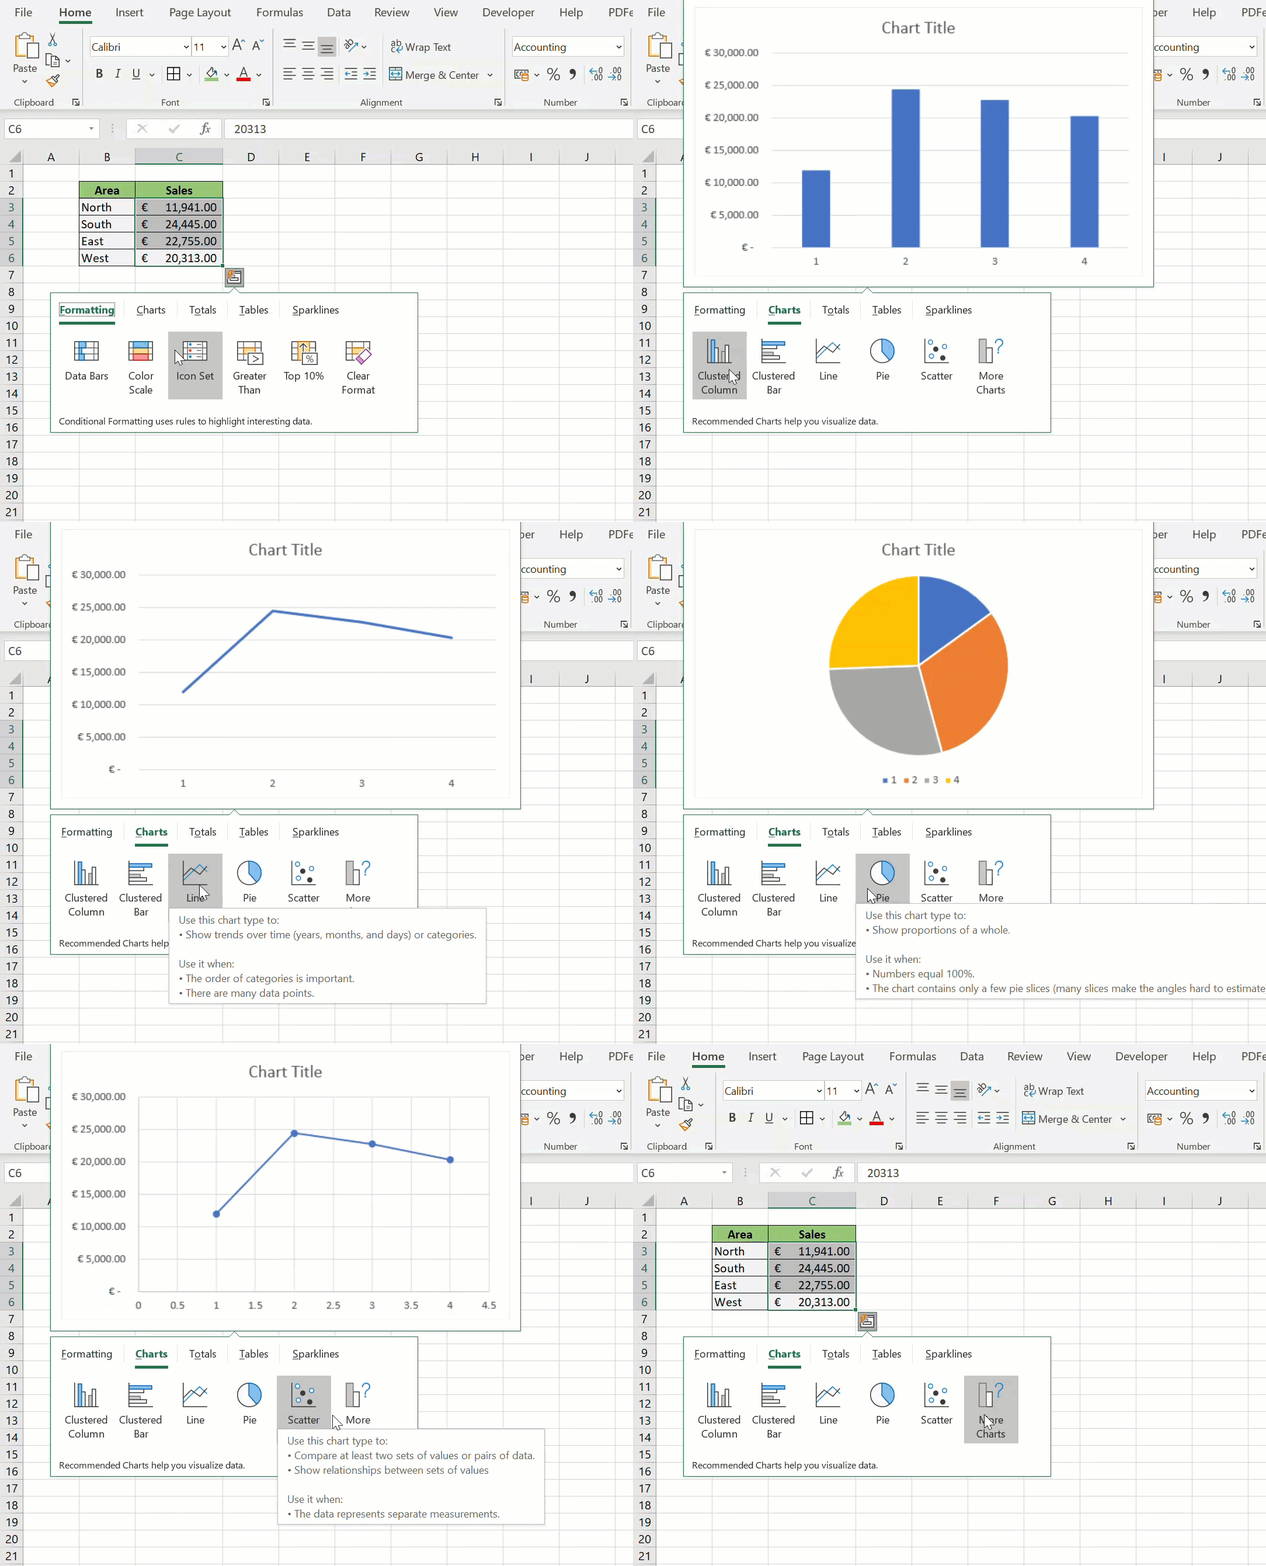
Just like with the Conditional Formatting, if you want full access to all of the Charting options, you can navigate to the Insert Tab | Charting Group.
Totals.
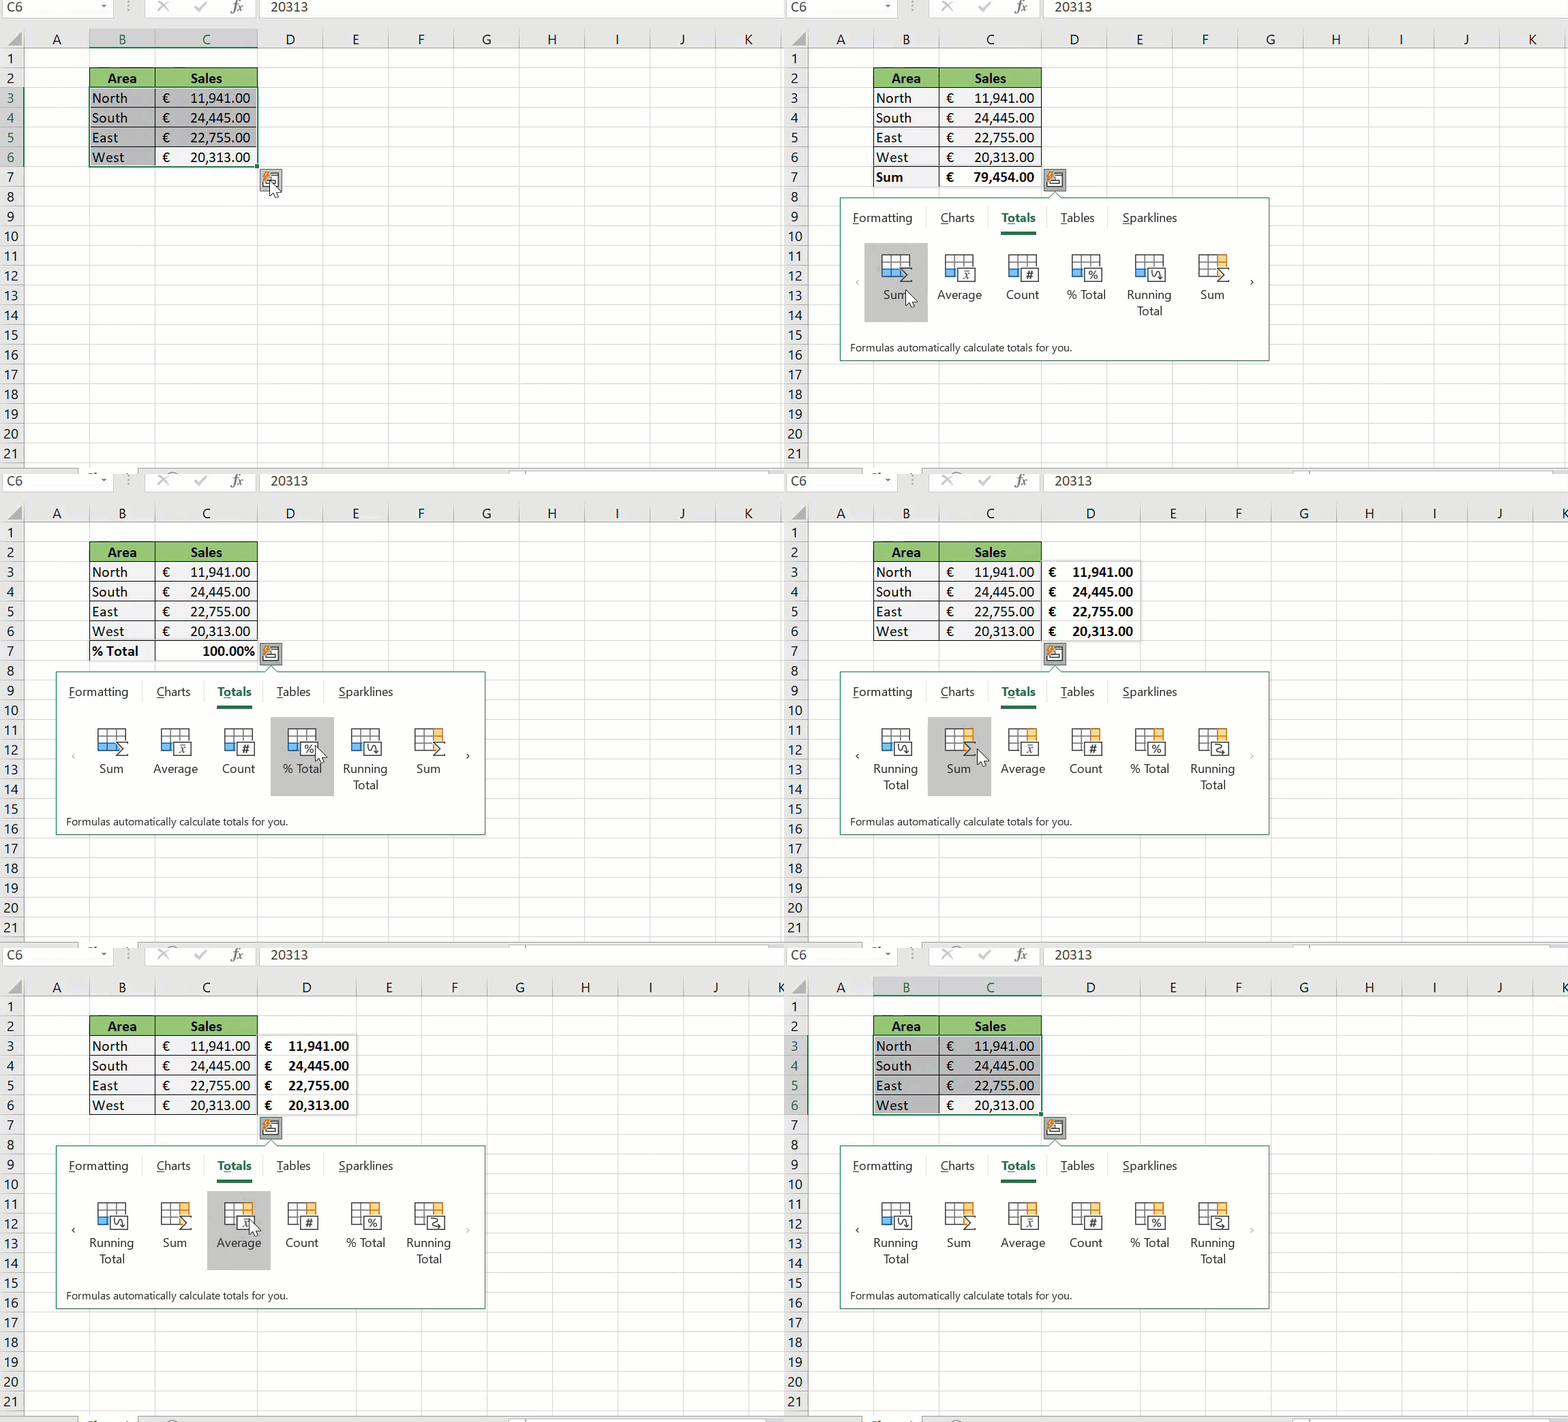
How about doing some quick calculations?. That would be very useful, wouldn’t it? The Total option gives you really quick access to all of the great basics of Excel calculations for your data set. Play around with it. It is super useful.
Tables.
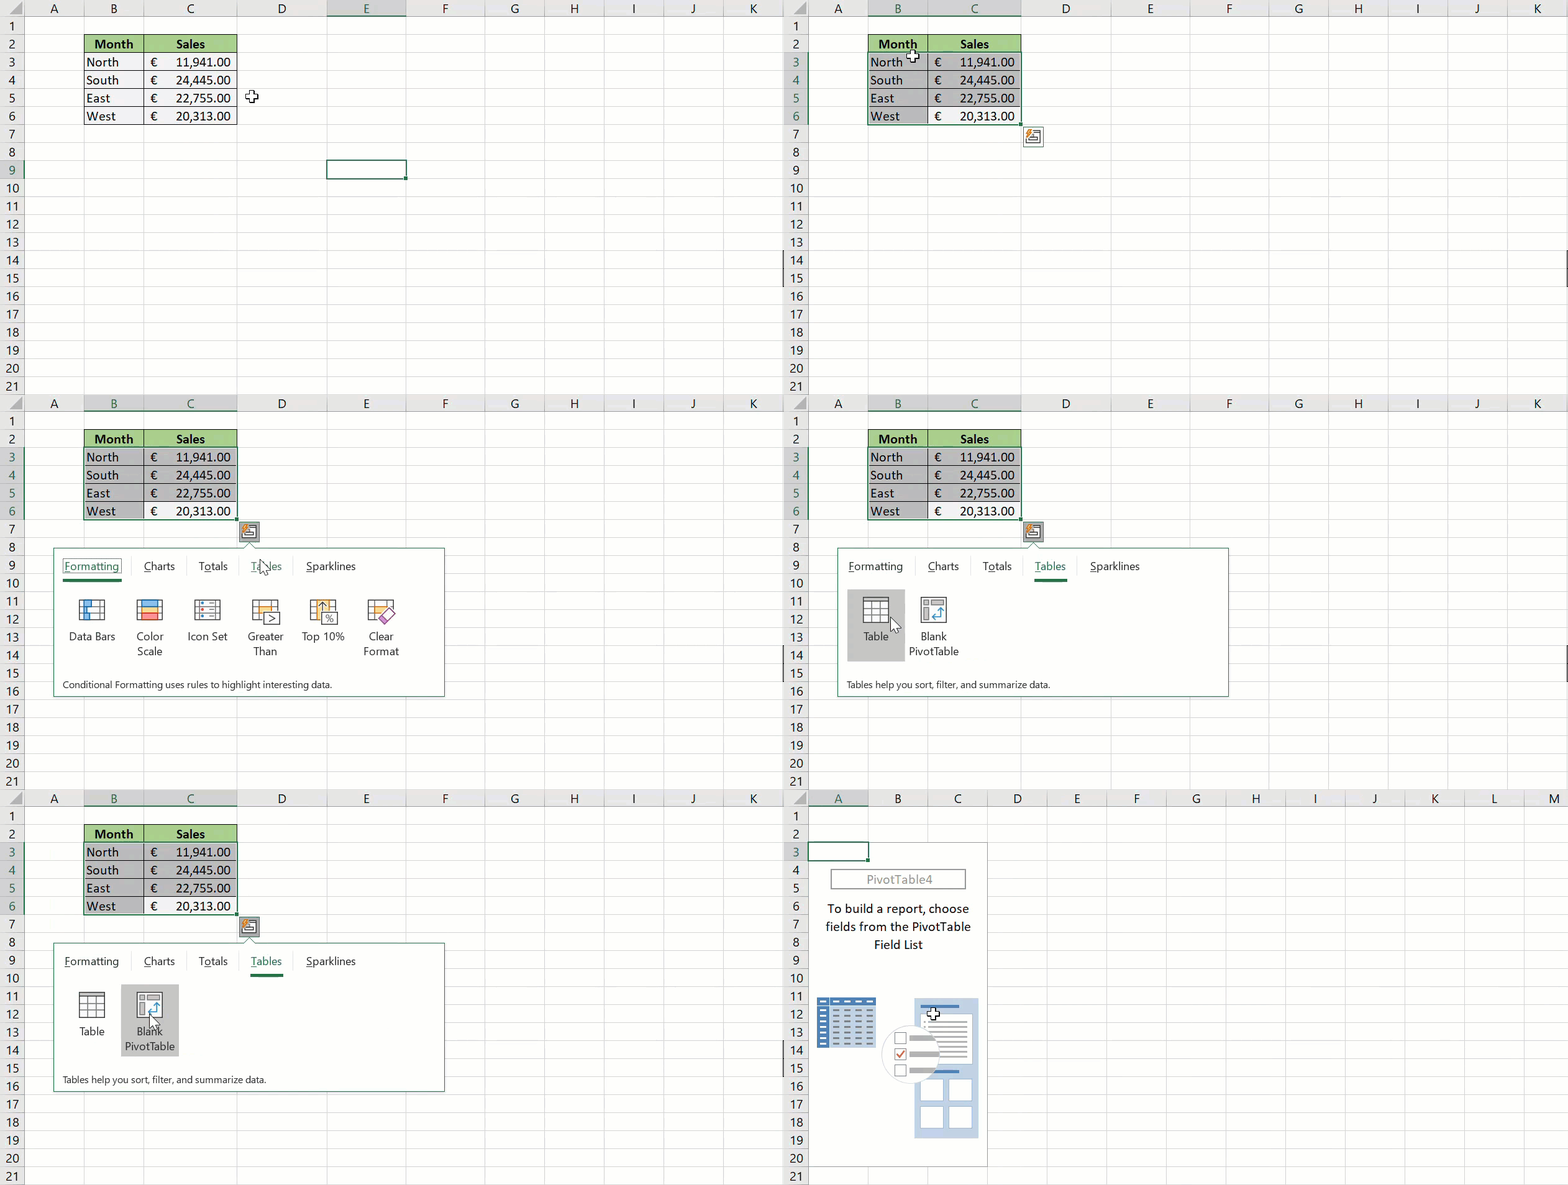
Excel Tables help you to filter, sort and summarize your data. In the Quick Analysis Tool, there are both Pivot Table and Table options available. Under Tables, you can have a preview of what the data is like in an Excel Table. But, in the Pivot Tables, no preview is available as once it is clicked, an empty Pivot Table is loaded. This is ready to add data.
Spark Lines.
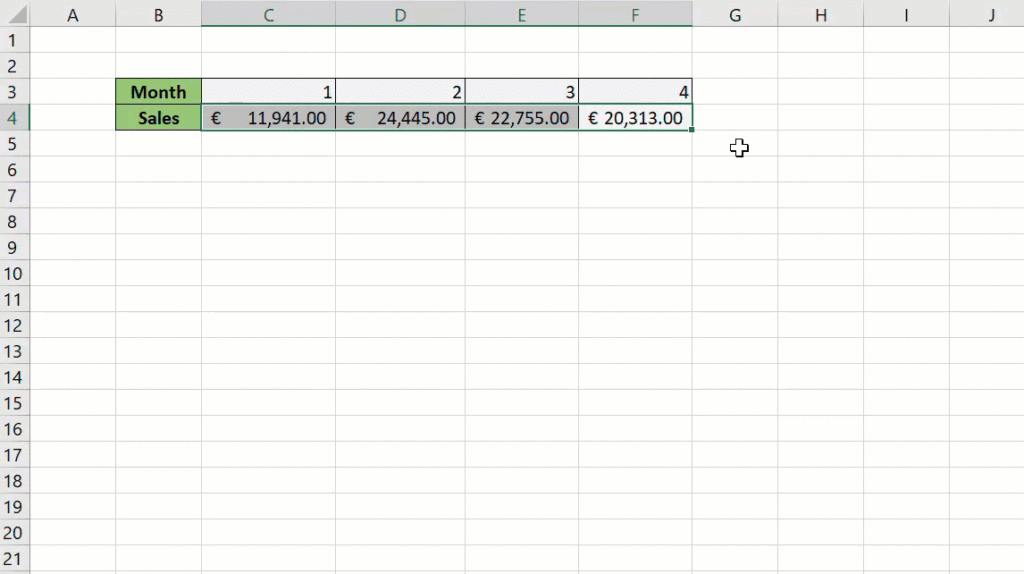
Finally, let’s take a look at the quick sparkline analysis that is available. This time I have changed the sample around to make more sense for a sparkline chart. I have created a monthly sales trend which we can visualize with the chart.
The Quick Analysis Tool feature is very useful. For a quick look at data trends and visualisations of your Excel data within seconds it is superb.
Turning Off The Quick Analysis Feature.
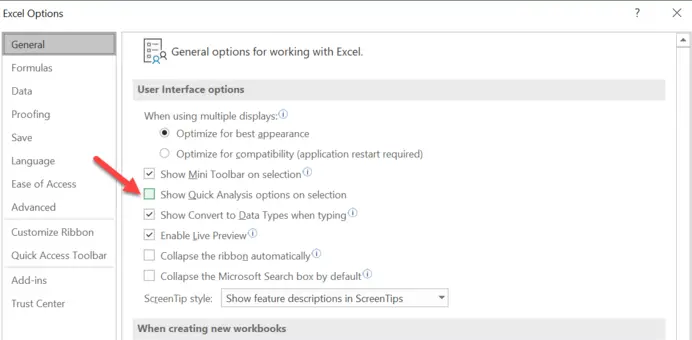
If you do not want the option of the Quick Analysis feature you can disable it. Follow the simple steps below:
- File | Options
- Select the General Tab
- In the User Interface Options UN-TICK the Show Quick Analysis options on selection
Remember if you want to use the feature again, you can easily go right back to your Excel shortcut of Ctrl+Q