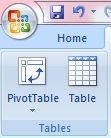
My Top 5 Reasons Why You NEED To Know Pivot Tables.
It could be argued that Excel’s most powerful analytical tool is the Pivot Table command. The more basic or manual ways of analyzing data in Excel such as sub totals, worksheet formulas as well as data validation and manual cross tab queries all fall short of the dynamic flexibility that Pivot Tables have, in particular when you increase the size of the data set you are analyzing.
The Pivot Table allows you to summarize data in a condensed format with the extra added functionality of a cross tabulation summary, add in the ability to easily rearrange and display parts of the data set in multiple views. Hence the name “Pivot Table”.
Imagine trying to analyze 9000 rows of a data set to find the Sales Person in the North East that sold the most Widget A’s in August 2010. Phew good luck with that using advanced filtering, subtotals..nightmare. Once your data volumes get above a manually manageable size, you need to bring in the powerful pivoting brigade!
I want to share with you my top reasons for getting familiar with Excel Pivot Tables- apart from working smarter and faster, and of course retaining your title as the office Excel guru!
Let’s get started!
1. You can analyze huge amounts of information with a few clicks. The powerful pivot table wizard takes you step by step through building your table and it takes up little space on your worksheet!. 900 or 9000 lines, that’s fine with a pivot. The data set can be summarized with functions such as SUM, AVERAGE, and COUNT with totals and sub totals. The rows and columns can be rotated in the table to see different summaries of the source data set. This allows a three dimensional summary or view of a two dimensional data set.
2. The ability see patterns and trends in your data set. Remember the Sales of Widgets by the North East Sales Person in August 201. We could add in all months for 2010 and see if there any trends in Sales of A Widgets or add in all Sales People for North East to see if any others are having trouble selling A Widgets in the North East. Real business decisions can be made using this type of easily analyzed and displayed information.
3. The pivot table data is interactive and dynamic. The way the data set is analyzed and displayed can immediately be changed within the pivot table with a few clicks. The user can easily categorize data in groups, and perform calculations in a fraction of the time by interactively dragging and dropping fields within the pivot table. This changes the perspective and recalculation of totals which are immediately reflected in the current view
4. Using pivots to analyze data can cut in half the number of human interactions it takes to perform calculations. This increases the efficiency and accuracy of data analysis. Being able to powerfully analyze large volumes of data in a few clicks increases efficiency and by removing the amount of human interaction it cuts out the likely hood of errors.
5. The ability to organize data so its easy to chart, pivot tables force a layout of data that is really easily to turn into great charts. You can even create a pivot chart which is automatically generated when you choose that available option. This chart then also contains all of the features of a pivot table for displaying data, and you change choose and change fields to display in your chart with the flexibility of your pivot table.
These are my personal top five reasons you really need to know pivot tables.
They are a classic business tool that will allow you to see trends in your data, look at your data from different angles all from a few clicks of a mouse. Your data crunching will seem faster and simpler once you get to grips with the pivots.
[callout title=Want EVEN MORE Excel Tips To Help You Work Smarter?] Get 101 Excel Tips From An Excel Addict. Yes 101 Excel Tips to help you work smarter and faster. This Ebook is stuffed with great tips and tricks to help you continue to Excel At Excel [/callout]

