Yes indeed Excellers it is Pivot Table week at how to excel at excel.com
For some they are something they cannot live without in Excel world, for others they make them run screaming away at the very  mention of the name.
Let’s sit back and take a good look at this wonderful feature of Excel.
Firstly What ARE Pivot Tables?
Well, in a nutshell they are a feature in Excel that allows you to see patterns and trends in large amounts of data in a very short space of time. You can summarize, analyze,explore, tabulate and present your data in many different ways with a few clicks of your mouse.
 Whether your data is 500 or 500000 rows the Excel Pivot Table is the THE data analysis tool to have in your Excel toolbox.
Pivots allow you to summarise your data in a condensed form, and at the same time having the functionality of a cross tabulation summary, i.e. you can easily rearrange and display different parts of your data set in multiple views, hence the name Pivot Table.
Essentially you can pivot your data and move it around to analyze in numerous ways. You can turn a two dimensional data set into a three dimensional one or a dynamic data set.
Example uses of Pivot Tables- there are many but let’s detail a few to get an idea…
- Summarizing data – for example, sales per sales person, per region, per product per period of time- no problem with a pivot
- Filter, drill down, sort data on reports with little effort and absolutely no macros or programming – cool
- Show your data as percentages, average, min, max- the list goes on and on…….
All of this with a couple of clicks!! in Excel.
Where Can My Data Come From?
The data for your Excel Pivot Table analysis can come from an Microsoft Excel list, a relational database file, and OLAP(Online Analytical Processing)Cube or indeed multiple consolidation ranges of data ( that is multiple sources containing similar data) which the Pivot Table can assemble and summarize.
Pivot Tables are linked to the source of data from which they are derived, so if your Pivot Table is based on data stored outside of Excel i.e External Data you can choose to have refreshed at regular time intervals or refresh it whenever you want to.
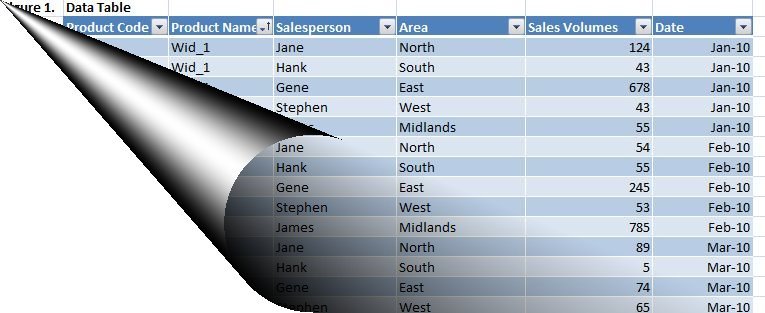
If your data is from an Excel data source then, then is should follow the criteria for a well constructed data list. It should have
- Columns labels at the top ( the field headings become the field names in the Pivot Table).
- Each column should contain a particular kind of data item, and there should be no blank rows within the range,
- If your range already contains subtotal, totals or any other type of summary information then delete them as the Pivot will perform its own calculations.
In the next session we will jump right in a create your first Pivot Table.
Session 2 Create Your First Pivot Table
Other Links You Might Like
1. Excel Formula Crash Course with download option
2. Excel Formula Crash Course– view online
3. Data Validation Using Lists
4. Highlight All Cells that Contain A Formula
[amazonjs asin=”0789748754″ locale=”US” tmpl=”Small” title=”Excel 2013 Pivot Table Data Crunching (MrExcel Library)”]
[amazonjs asin=”1590594320″ locale=”US” tmpl=”Small” title=”A Complete Guide to PivotTables: A Visual Approach”]
[amazonjs asin=”0470591617″ locale=”US” tmpl=”Small” title=”Excel PivotTables and PivotCharts: Your visual blueprint for creating dynamic spreadsheets”]

