0:00
hi everyone my name is Barbara welcome
0:01
back to my YouTube channel today I'm
0:03
going to show you how to change the
0:04
default type of chart in Excel so by
0:08
default Excel will create a column chart
0:11
for you if you haven't changed these
0:12
settings so if I was to create by
0:15
shortcut alt F1 and insert a chart it is
0:20
a column chart but depending on the type
0:23
of data you use on a regular basis you
0:26
might want this to be something else
0:28
there's a quick and easy way to change
0:29
the default chart if you quickly create
0:31
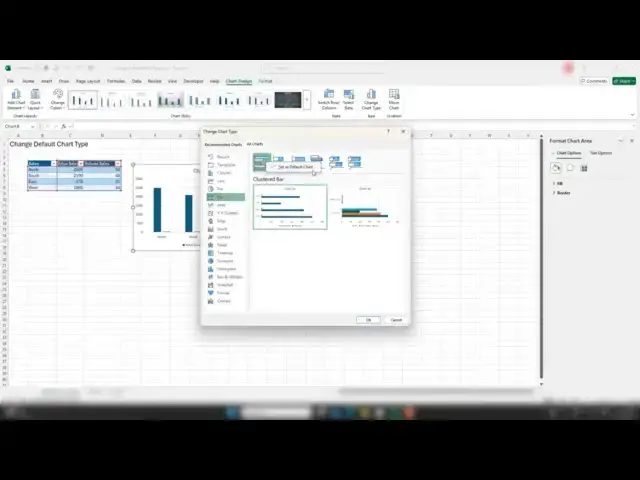
a chart so what you need to do is select
0:34
your chart and go to the chart type
0:38
options click and then all the types of
0:42
chart that you would be using would be
0:45
here so let's change this to a clustered
0:47
bar chart instead of a column chart and
0:51
to select the one that you want as
0:52
default you can right click and set as
0:55
default the tick will appear hit
0:58
okay so this is the type of default
1:01
chart that I want Excel to create so
1:04
let's test it let's just delete the
1:06
chart go back in select Alt F1 and it
1:10
has created for me clustered bar chart
1:14
instead of the column chart so that's a
1:17
real quick easy way to change the
1:19
default chart in Excel that's created
1:21
for you useful if you use a lot of
1:23
charting and it's a very particular type
1:25
if you found the tip useful please
1:27
subscribe hit the notification bell and
1:29
you'll be notified when I upload another
1:31
Excel video if you've got any questions
1:33
leave them down below and I'll answer
1:36
them and hopefully see you next time for
1:38
another video thanks for watching